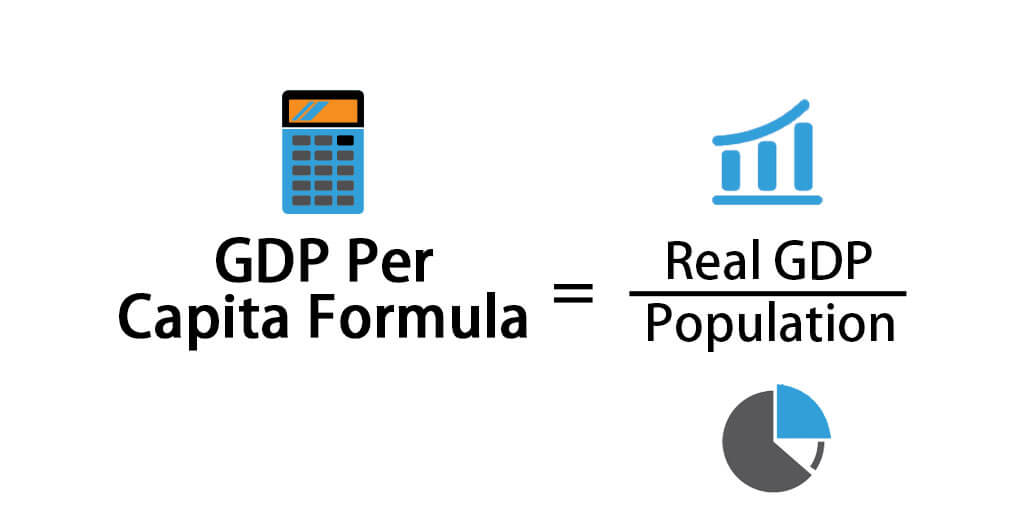
Per capita being a statistical concept means ‘per person’. This said, per capita income (PCI) is an individual’s average income earned in a country in a year. Usually, it is calculated to review the population’s average earning for comparison with other populations. For instance, assume there are five salaried individuals in a room. However, they have distinct specialisation areas and earn distinct salaries. Consider the salaries earned by them are as follows:
1) Rs. 1 lakh
2) Rs. 2 lakh
3) Rs. 1.50 lakh
4) Rs. 90,000
5) Rs. 1.90 lakh
As the salaries are different, for a better idea on the income front of this group, you must look at PCI. PCI for this group will be Rs. 1.46 lakh.
Table of Contents
How is per capita income calculated?
There are 2 major parts to compute the PCI formula – the overall income drawn by the population and the population size. Formula is – PCI = Overall population income/population size. Thus, in the instance stated above,
Overall population income = Rs. 7.30 lakh (Rs. 1 lakh + Rs. 2 lakh + Rs. 1.50 lakh + Rs. 90,000 + Rs. 1.90 lakh)
Population size = 5
Thus, PCI = 7.30 lakh/5 = Rs. 1.46 lakh
If we change this example a little and make the total number of individuals to 10, wherein the additional 5 are unemployed, then the PCI will be 7.30 lakh/10 = Rs. 73,000. Thus, while calculating the PCI of a country, it is crucial to take every individual residing into consideration i.e., employed, and unemployed both.
Alternative indicator of global prosperity analysis
Like per capita income, per capita GDP too is used as a global measure to gauge a nation’s prosperity based on its economic growth. Government considers per capita GDP to know how the economy is growing along with its population. Four key components of the GDP include consumer spending, business spending, exports, and government spending. All these 4 components that compute the GDP are often influenced by retail investors either positively or negatively through the stock market.
How does the bull stock market impact the GDP?
A bullish market refers to the rising equity market scenario. The stock market impacts GDP primarily by impacting consumer confidence and financial conditions. If the share market shows an elevating trend – there tends to be an elevated level of optimism in the economy. As there is a good demand for equities in such phases, companies issue shares in stocks to raise capital to use the funds to invest in projects, expand operations and hire workers. Retail investors review different stocks to buy and buy them as per their preference and risk appetite. This activity boosts the GDP.
A rising GDP indicates the economy is performing, and companies can further raise more funds by issuing new debt or borrowing from banks. This further boosts the GDP. With an increase in stock prices, investors hold more wealth and are optimistic about the future. Such confidence results in enhanced spending, which can be in the form of automobiles, homes etc.
How does a bearish market impact the GDP?
Contrarily, when the stock market dips, it is called bearish, which means a fall in the stock market and a negative impact on investment sentiment. Unlike bullish markets, where investors review various stocks to invest and finally invest, in bearish markets, investors often rush to sell off their stock to prevent any losses. Usually, such losses result in a pullback in consumer spending, especially if there is also a fear of recession. Reduced spending on the consumer end hits the revenues and sales of companies. And companies, in turn, are propelled to lower their expenditure and cut down on staff/employees. Rising unemployment leads to a drop in consumer confidence, which converts to reduced investment in the stock market. All of these have a negative effect on the GDP.
Note that a bearish market was observed in 2020, which has made investors more alert and many of them now analyse the stock market today before investing. They do so by comparing the stock to buy today to their peers.

